How to Detect Bottlenecks in a New PC Build
Learning how to detect bottlenecks in a new PC build is one of the smartest first steps you can take right after finishing a fresh setup or upgrade. Even when every single part you chose is powerful and expensive, one weaker or restricted piece can quietly set a ceiling on your entire system’s performance.
This is especially common with brand-new builds, since parts are often chosen based on price, brand reputation, or specifications on paper, without ever confirming how those parts actually behave once they are all working together. Because of this, someone can install a genuinely powerful graphics card and a modern, capable processor, and still end up dealing with low or unstable frame rates, stuttering, slow exports, high temperatures paired with disappointing performance, or loading times that feel far too long for such “fast” hardware.
In this guide, we will walk through exactly how to detect what is really holding your new build back, step by step, using simple, easy-to-follow methods. We will keep everything simple and easy to follow.
Who Should Care About This
This process is genuinely useful for a wide range of computer users, not just competitive gamers. This includes gamers hoping for smooth, stable frame rates, creators working with video editing or 3D software, users running artificial intelligence or simulation-heavy workloads, everyday office users dealing with unexpected lag, and anyone building or assembling a brand-new system who simply wants to confirm everything is working as it should.
If your new computer feels weaker than you expected, this step-by-step process will help you understand exactly why.
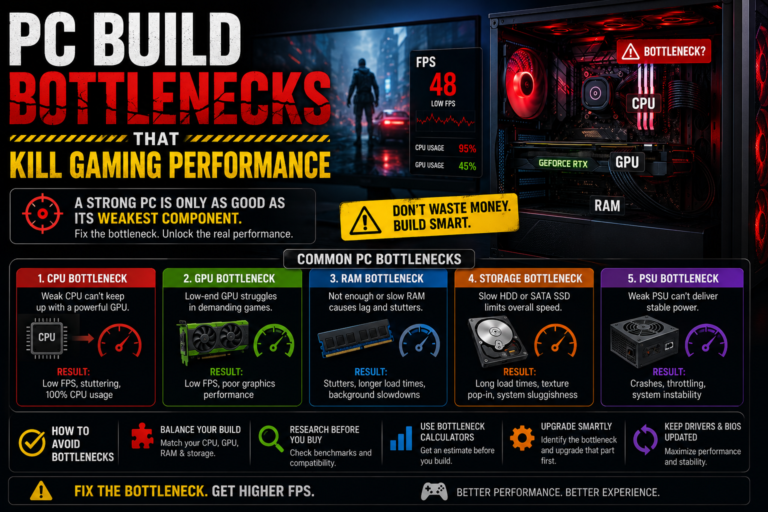
The Five Main Types of Bottlenecks to Understand
Before diving into testing, it helps to understand the different categories a bottleneck can fall into.
A Processor Limit
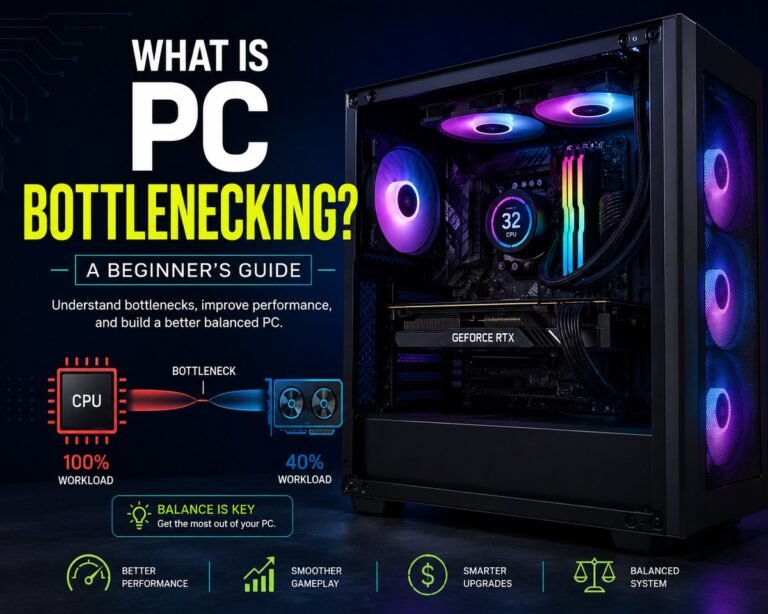
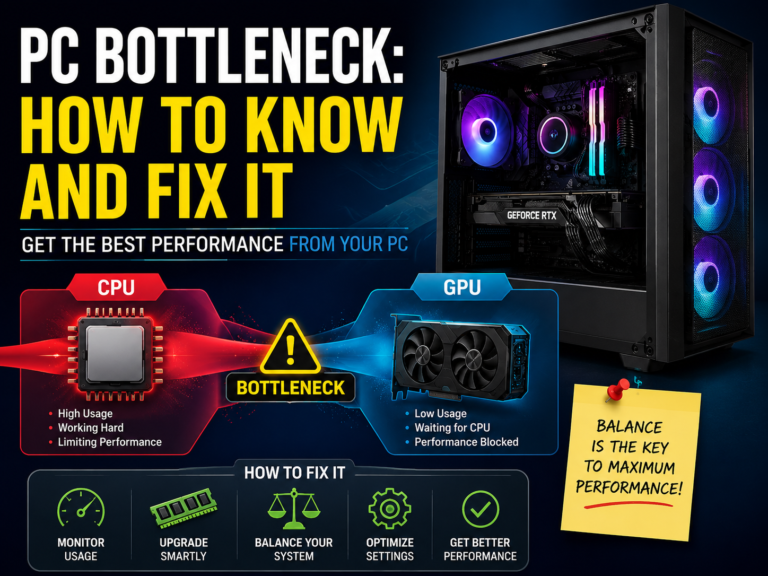
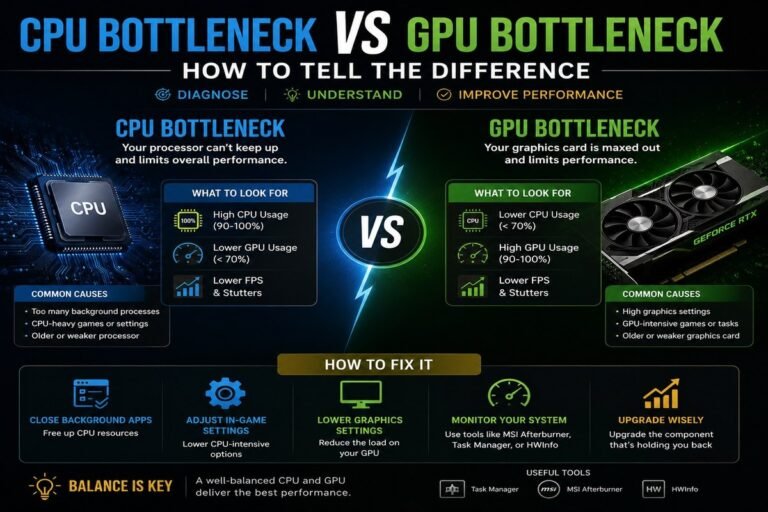
This happens when your processor cannot prepare game or program instructions fast enough to keep the rest of your system properly fed. You will often notice one or two specific processor cores staying pinned near their maximum, your graphics card usage sitting surprisingly low, your frame rate barely changing even when you lower your resolution, and stuttering appearing during busy, demanding moments. This type of limit often shows up in fast, high-frame-rate gaming, detailed strategy games, and heavy multitasking situations.
A Graphics Card Limit
This happens when your graphics card is already working at its full capacity. You will typically see your graphics card usage staying consistently very high, your frame rate scaling clearly with your resolution or graphics settings, and your processor usage remaining fairly moderate in comparison. It is worth remembering that this is not really a “problem” on its own. It simply means your graphics card is being properly and fully used.
A Memory Limit
This happens when your system memory limits either your available capacity or your overall speed. Watch for your memory usage climbing above roughly ninety percent, heavy storage drive activity happening during multitasking, stuttering when switching between different programs, and noticeable performance improvements after enabling a helpful memory speed setting. Your total capacity, your channel configuration, and how much stress is placed on your memory controller can all play a role here.
A Storage Limit
This happens when your storage drive simply cannot deliver information fast enough. Signs include your storage drive usage reading at one hundred percent, slower than expected boot times and program launches, visible texture pop-in or delayed loading of game assets, and noticeable hitching while working within editing software. Moving up to a faster type of storage drive can often dramatically improve how responsive your entire system feels.
A Thermal or Power Limit
This happens when your hardware automatically slows itself down to stay safe. Watch for sudden frame rate drops appearing after several minutes of continuous use, your processor or graphics card clock speeds visibly decreasing under sustained pressure, unusually high temperatures, and loud fan noise paired with genuinely disappointing performance. These issues are very often mistakenly blamed on “weak hardware,” when the real cause is actually related to cooling, case airflow, power supply quality, or motherboard power delivery instead.
A Simple Way to Think About Detection
Instead of guessing randomly, it helps to think about bottleneck detection using one simple combined idea: usage level, clock speed behavior, and how performance scales when conditions change.
You are essentially trying to answer three connected questions. Which specific component reaches its limit first? Are that component’s clock speeds staying stable, or are they being restricted in some way? And how does your overall performance change when you deliberately adjust your workload conditions?
Looking at these three things together helps reveal both obvious bottlenecks and quieter, more hidden ones that a single number alone would never show you.
Step One: Set Up Proper Monitoring
Before testing anything, it helps to have at least one detailed monitoring tool, along with a simple real-time overlay you can view during actual gameplay or work.
While testing, keep an eye on your individual processor core usage, your graphics card usage and its own dedicated memory usage, your overall system memory consumption, your temperatures across different components, your clock speeds, and your overall power draw.
Step Two: Test Real Tasks, Not Just Quick Benchmarks
Short benchmark tools can help establish a rough baseline, but true bottlenecks usually reveal themselves much more clearly during real, everyday use.
Test the specific game you play most often. Test your actual editing or rendering software if that applies to you. Test any simulation or creative workloads you regularly rely on. And test your normal, everyday multitasking setup as well. Let each of these tests run for at least ten to fifteen minutes, since this gives your system enough time for temperatures to properly stabilize.
Step Three: Watch the Usage Patterns Closely
Once your test is running, pay close attention to how your different components behave in relation to each other.
If your graphics card usage stays very high while your processor usage stays fairly moderate, your graphics card is likely your true limiting factor. If one specific processor core stays maxed out while your graphics card usage stays low, your processor is likely the true limit instead. If your memory usage is nearly full alongside sudden spikes in storage activity, your memory setup deserves closer attention. If your temperatures are climbing while your clock speeds are visibly falling, you are likely dealing with a thermal or power-related issue. And if your storage drive itself is reading at its maximum usage level, your storage speed may be the true bottleneck.
If nothing appears to be fully maxed out, yet your performance still feels disappointing, it is worth looking more closely at your clock speed behavior and your overall frame timing consistency instead.
Step Four: Try Changing One Thing at a Time
A particularly reliable way to confirm your true bottleneck is to adjust just one setting at a time and carefully observe what happens.
Try testing at a lower resolution, then a moderate resolution, and finally a much higher resolution. Separately, try testing your graphics settings at their lowest level, then a medium level, and finally their highest level.
If your frame rate barely changes at all during these tests, this points toward a processor or software-related limit. If your frame rate drops sharply as you increase your resolution or settings, this points toward a graphics card limit instead. And if your frame rate feels genuinely unstable over time, regardless of your specific settings, this often points toward a thermal or power-related restriction.
This kind of careful, one-variable-at-a-time testing is one of the most reliable ways to truly confirm what is happening inside your system.
Step Five: Look Closely at Clock Speeds and Thermal Behavior
It is entirely possible for a component to show only moderate usage on paper, while still being quietly restricted behind the scenes.
Watch closely for your processor or graphics card clock speeds dropping unexpectedly, specific thermal or power-limit warnings appearing within your monitoring tool, and general voltage or frequency instability during sustained, heavy use. This is exactly how weaker cooling, a lower-quality power supply, weak motherboard power delivery, or poor case airflow can quietly place a hidden cap on your true performance.
Hidden Bottlenecks That Many New Builders Miss
A surprising number of underperforming new computers are not actually limited by their processor or graphics card at all.
Common hidden culprits include memory running in a slower single-channel setup instead of a proper dual-channel one, a helpful memory speed setting being left switched off within your basic system settings, cooling or mounting issues affecting how well heat is actually being transferred away from your hardware, motherboard power delivery components restricting your ability to sustain higher clock speeds, an aging or underpowered power supply limiting your available power delivery, shared data pathways being split between your graphics card and certain storage drives, and outdated or conflicting drivers and firmware.
These specific issues rarely show up clearly within simple online bottleneck calculators, but they become much easier to spot once you start reviewing real, hands-on monitoring data for yourself.
The Fastest Way to Tell CPU vs. GPU Limits Apart
A genuinely quick way to figure out which of these two common limits applies to your specific situation is to ask yourself two simple questions.
Is your graphics card usage staying consistently high throughout your test? And does your frame rate change in a meaningful way when you adjust your resolution?
If your graphics card usage stays low and your resolution does not seem to matter much at all, your system is likely limited by your processor. If your graphics card usage stays high and your resolution clearly impacts your frame rate, your system is likely limited by your graphics card instead. Neither of these results is inherently “bad” on its own. It only becomes a genuine problem when it directly conflicts with what you originally built your computer to actually do.
Using Benchmark Tools the Right Way
While standard benchmark tools cannot fully replace real, hands-on testing, they can still add helpful clarity to your overall picture. Useful benchmarks can help you understand your processor’s scaling and cooling behavior, evaluate your overall graphics and system balance, test a mix of different workload types, and measure your storage drive’s true throughput speed.
It is most helpful to run these benchmarks before making any changes, again after any firmware updates, and once more after any cooling or memory-related adjustments. The real goal here is honest comparison over time, not simply chasing the highest possible score.
Deciding What to Do Next: Optimize, Upgrade, or Redesign
Once you have a clearer picture of your true bottleneck, it becomes much easier to decide on the right next step.
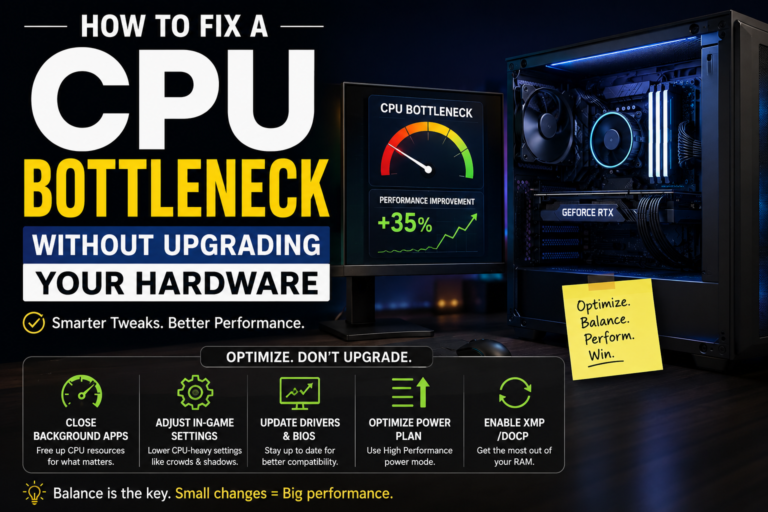
It generally makes sense to optimize first when your temperatures are running high, your memory is not properly configured, your drivers or firmware are outdated, your storage is overloaded, or background programs are dominating your available resources.
It generally makes sense to consider an upgrade when one specific component is consistently maxed out, your performance clearly scales in a logical, predictable way as you adjust settings, and your actual workload has genuinely grown beyond what your current system was originally designed to comfortably handle.
It may be time to consider a more significant redesign when your power delivery feels genuinely unstable, your motherboard is clearly limiting your clock speeds, or your cooling setup simply cannot keep up with sustained, heavy use. These particular situations point toward a deeper, foundational issue rather than a simple, single-part fix.
Common Mistakes Worth Avoiding
A few common mistakes can lead people toward the wrong conclusion entirely. These include judging your system only by a single average frame rate number, ignoring your frame timing consistency altogether, upgrading your graphics card when your memory was actually the true limiting factor, blaming your processor when overheating was the real underlying cause, relying completely on simple online calculators, and testing only one single game or benchmark before drawing a final conclusion.
It helps to remember that a true bottleneck is never just one single number. It is a genuine behavior pattern that reveals itself over time and across different conditions.
Final Thoughts
Every computer has some kind of limiting factor. Real problems only arise when that particular limit directly conflicts with what you actually built or bought your system to accomplish in the first place.
Learning how to properly detect bottlenecks in a new PC build is not about guessing randomly, and it is not about blindly trusting a simple online calculator either. It is about carefully observing your real usage patterns, your clock speed behavior, your temperatures, and how your performance genuinely scales under real, hands-on testing.
Once you truly understand what is holding your specific system back, the right next step becomes far clearer: optimize what you have, upgrade the specific part that truly needs it, or address a deeper, more foundational issue. That kind of clarity saves you real money, protects your hardware over the long run, and turns a disappointing new build into the genuinely capable machine you originally set out to create.