How to Detect Bottlenecks in a New PC Build
A PC bottleneck happens when one component limits the performance of the entire system. Even if every other part is powerful, the slowest or most restricted element sets the ceiling.
In new PC builds, bottlenecks are especially common because parts are often chosen for brand, budget, or specs on paper—without validating how they behave together under real workloads.
This is why someone can install a powerful NVIDIA GeForce RTX GPU or a modern AMD Ryzen or Intel Core CPU and still experience:
- Low or unstable FPS
- Stuttering and micro-freezes
- Slow renders or exports
- High temperatures with poor performance
- Long load times despite “fast” hardware
Detecting bottlenecks early protects your budget, prevents unnecessary upgrades, and helps you tune the system you already paid for.
Who This Guide Is For
This applies to anyone running a new or recently upgraded system, including:
- Gamers chasing stable frame pacing and higher FPS
- Creators using Premiere Pro, DaVinci Resolve, Blender, or Unreal Engine
- AI and 3D users relying on CUDA, VRAM, and PCIe throughput
- Office and workstation users experiencing lag or slow multitasking
- Builders and system integrators validating new PC builds
If your PC feels weaker than expected, this process will show you why.
The Five Main Types of Bottlenecks
Understanding the categories helps you interpret what your system is telling you.
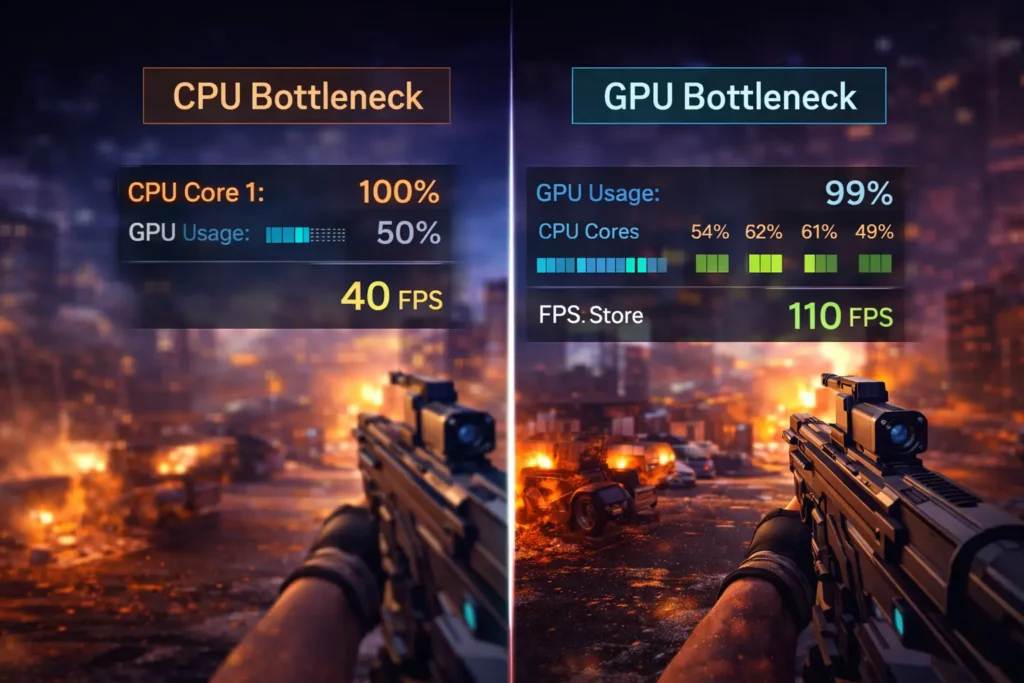
1. CPU Bottleneck
The processor can’t prepare frames or instructions fast enough.
Common signs:
- One or two CPU cores pinned near 100%
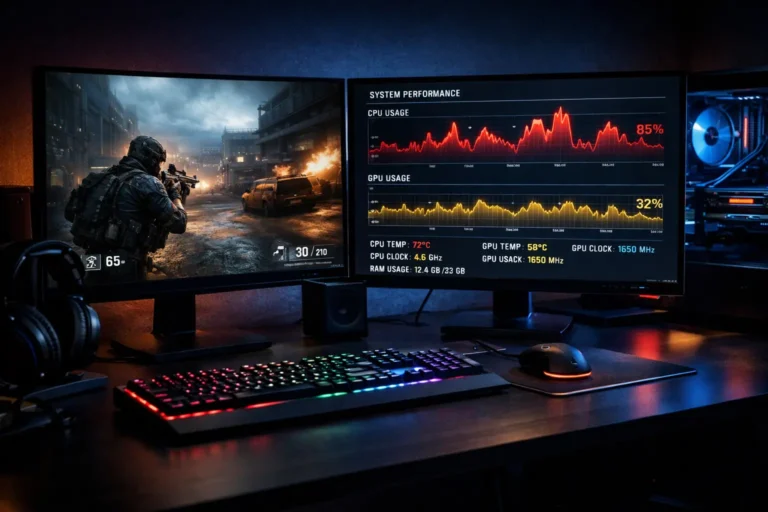
- GPU usage sitting low (40–70%)
- FPS barely changes when lowering resolution
- Stutters in open-world games, simulations, or multitasking
Often appears in high-FPS gaming, strategy titles, emulators, streaming setups, and heavy background workloads.
2. GPU Bottleneck
The graphics card is doing all it can.
Common signs:
- GPU utilization consistently 95–100%
- FPS scales clearly with resolution or graphics settings
- CPU usage moderate
- Long render times and AI workloads limited by VRAM
This is not a “problem” bottleneck—it simply means your GPU is fully used.
3. RAM Bottleneck
System memory limits capacity or speed.
Common signs:
- RAM usage above 90%
- Heavy disk activity during multitasking
- Stutters when switching apps or loading assets
- Big performance jumps after enabling XMP or EXPO
Capacity, channel configuration, and memory controller stress all matter.
4. Storage Bottleneck
Data cannot be delivered fast enough.
Common signs:
- 100% disk usage
- Slow boots and application launches
- Texture pop-in or delayed assets
- Editing timelines hitching
Moving from HDD to SATA SSD to NVMe can dramatically change system responsiveness.
5. Thermal or Power Bottleneck
Hardware slows itself to stay safe.
Common signs:
- Sudden FPS drops after minutes of load
- CPU or GPU clocks decreasing under stress
- High temperatures
- Loud fans with disappointing performance
These are often misdiagnosed as “weak hardware” when they’re really cooling, case airflow, PSU, or motherboard VRM limitations.
The Professional Detection Framework
Instead of guessing, use this simple system:
Bottleneck = Utilization + Clocks + Scaling
You are looking for:
- Which component reaches its limit first
- Whether clocks remain stable or are being restricted
- How performance changes when workload conditions change
This combination exposes both visible and hidden bottlenecks.
Step-by-Step: How to Detect Bottlenecks in a New PC Build
Step 1: Install Proper Monitoring Tools
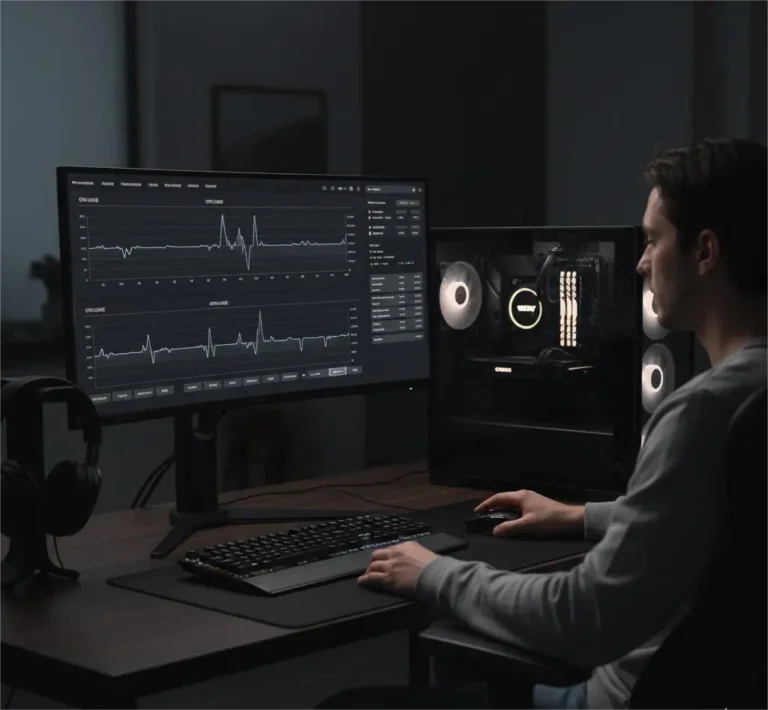
Use at least one deep sensor tool and one real-time overlay.
Recommended options:
- HWiNFO64 – full system sensors, thermal and power flags
- MSI Afterburner + RivaTuner – in-game CPU/GPU/RAM overlays
- Windows Task Manager – quick confirmation
- CapFrameX or OCAT – frametime and consistency analysis
Track:
- CPU per-core usage
- GPU utilization and VRAM usage
- RAM consumption
- Temperatures
- Clock speeds
- Power draw
Step 2: Test Real Workloads (Not Just Benchmarks)
Synthetic tools like Cinebench and 3DMark help establish baselines, but bottlenecks reveal themselves in real usage.
Test:
- Your main game
- Your editing or rendering software
- Your AI or simulation workload
- Your usual multitasking environment
Let each run for 10–15 minutes so thermals stabilize.
Step 3: Observe Utilization Patterns
Use this quick diagnostic table:
| Observation | Likely Bottleneck |
|---|---|
| GPU 95–100%, CPU moderate | GPU |
| One CPU core maxed, GPU low | CPU |
| RAM nearly full, disk spikes | Memory |
| High temps, clocks falling | Thermal / power |
| Disk at 100% usage | Storage |
If nothing is fully used but performance is poor, look at clock behavior and frametime consistency.
Step 4: Perform Scaling Tests
Change only one variable at a time.
Resolution scaling:
1080p → 1440p → 4K
Preset scaling:
Low → Medium → Ultra
Interpretation:
- FPS barely changes → CPU or engine bottleneck
- FPS drops sharply → GPU bottleneck
- FPS unstable over time → thermal or power restriction
This “workload scaling” step is one of the most reliable bottleneck indicators.
Step 5: Check Clocks and Thermal Limits
A component can show only 60–70% usage but still be restricted.
Look for:
- CPU or GPU clock reductions
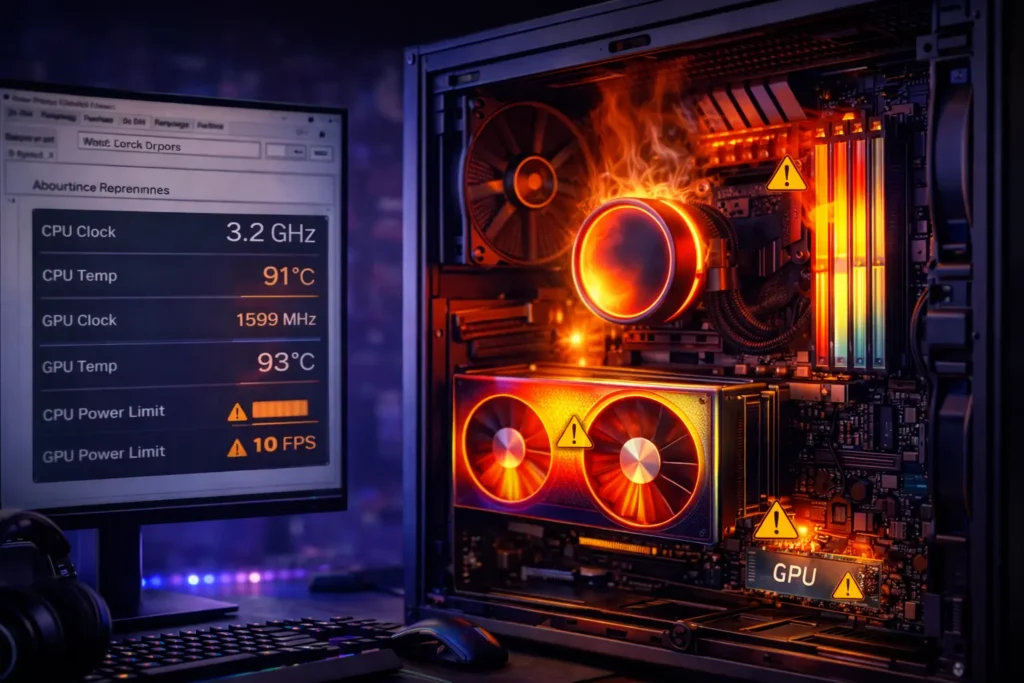
- “Thermal throttling” or “power limit” flags in HWiNFO
- Voltage or frequency instability
This is how cooling, PSU quality, motherboard VRMs, and case airflow quietly cap performance.
Hidden Bottlenecks Most Builders Miss
Many underperforming PCs are not CPU- or GPU-limited at all.
Common hidden limits include:
- RAM running single-channel instead of dual-channel
- XMP/EXPO disabled in BIOS or UEFI
- Thermal paste or cooler mounting issues
- Motherboard VRMs restricting sustained clocks
- Weak or aging PSUs limiting power delivery
- PCIe lanes shared with storage or expansion cards
- Driver conflicts or outdated chipset firmware
These rarely show up in “bottleneck calculators,” but they appear clearly in real monitoring data.
CPU vs GPU Bottleneck: The Fastest Way to Tell
Ask two questions:
- Is GPU utilization consistently high?
- Does FPS change meaningfully with resolution?
If GPU usage is low and resolution doesn’t matter, the system is CPU-limited.
If GPU usage is high and resolution heavily impacts FPS, the system is GPU-limited.
Neither is “bad.” It only becomes a problem when it conflicts with what you built the PC to do.
Using Benchmarks the Right Way
Benchmarks don’t replace real testing—but they add clarity.
Helpful tools:
- Cinebench R23 – CPU scaling and cooling behavior
- 3DMark Time Spy / Fire Strike – GPU and system balance
- Geekbench 6 – mixed workloads
- CrystalDiskMark – storage throughput
Run them:
- Before optimization
- After BIOS updates
- After cooling or RAM changes
The goal is comparison, not chasing scores.
Decision Guide: Optimize, Upgrade, or Replace?
Before spending money, identify which path your system belongs to.
Optimize First When:
- Thermals are high
- RAM is misconfigured
- Drivers or BIOS are outdated
- Storage is overloaded
- Background processes dominate
Examples: airflow changes, enabling XMP, reinstalling GPU drivers, reseating coolers.
Upgrade When:
- A component is consistently maxed
- Performance scales logically
- The workload has grown beyond the system
Examples: moving to a stronger CPU for high-refresh gaming, upgrading GPU for 4K, increasing RAM for editing.
Replace or Redesign When:
- Power delivery is unstable
- Motherboard limits clocks
- Cooling cannot handle sustained load
These are foundation problems.
Real-World Scenarios
Gaming PC with powerful GPU but low FPS:
Monitoring shows GPU at 50% and one CPU core pinned. This is a CPU bottleneck—often paired with memory speed or engine limits.
Editing workstation with constant stutter:
RAM usage at 95% and storage activity spiking. This indicates a memory and disk bottleneck, not GPU weakness.
High-end build that slows over time:
Temperatures climb, clocks drop. This is thermal throttling, not “weak hardware.”
AI workstation failing to scale:
VRAM fully used while system RAM remains free. This is a GPU memory bottleneck, not compute power.
Local Service and Upgrade Considerations
Even global PC users frequently search for:
- “PC performance test near me”
- “Custom PC builder”
- “Gaming PC shop”
- “PC upgrade service”
Local providers can help when:
- Thermal testing equipment is needed
- Warranty-safe upgrades matter
- Power delivery or motherboard issues arise
Typical service ranges vary by region:
- Diagnostics: free to mid-range service fee
- Cooling improvements: low to mid cost
- RAM upgrades: low to medium
- PSU replacements: medium
- GPU upgrades: high
Whether working with a local technician or doing it yourself, proper diagnosis prevents wasted spending.
Common Mistakes to Avoid
- Judging only by average FPS
- Ignoring frametime consistency
- Upgrading GPU when RAM is full
- Blaming CPU when thermals are the cause
- Relying entirely on online calculators
- Testing only one game or benchmark
A bottleneck is not one number—it’s a behavior pattern.
Preventing Bottlenecks in Future Builds
- Balance architecture generations
- Match target resolution to GPU tier
- Use dual-channel RAM
- Avoid low-quality PSUs
- Plan airflow before parts
- Stress-test before daily use
- Log sensor data during the first week
Validation is part of building, not an afterthought.
Conclusion
Every PC has a limiting factor. Problems only arise when that limit conflicts with what you built the system to do.
Detecting bottlenecks in a new PC build is not about guessing or calculators—it’s about observing utilization, clocks, thermals, and scaling behavior under real workloads.
When you understand what is actually holding your system back, the fix becomes clear: optimize, upgrade, or redesign. That clarity saves money, protects hardware, and turns a disappointing build into the machine you intended to create.
If your system feels underwhelming, don’t replace parts blindly. Measure first.
FAQs
1. How do I know if my new PC is bottlenecked?
Monitor CPU, GPU, RAM, temperatures, and clocks during real workloads. The component that reaches its limit first while others stay lower is your primary bottleneck.
2. Is 100% GPU usage a bottleneck?
No. It usually means your graphics card is fully utilized. A bottleneck becomes a problem only when it restricts your goals.
3. Can RAM really cause bottlenecks?
Yes. Low capacity, slow speeds, or single-channel setups frequently cause stutters, long loads, and unstable performance.
4. Can a motherboard or PSU limit performance?
Yes. Weak VRMs and power delivery can restrict sustained CPU and GPU clocks, creating hidden bottlenecks.
5. Are bottleneck calculators accurate?
They offer rough estimates only. They cannot detect thermals, power limits, memory configuration, or workload behavior.
6. Do bottlenecks damage hardware?
Not directly, but thermal and power bottlenecks can reduce lifespan if left unresolved.
7. Should I upgrade CPU or GPU first?
Only after monitoring shows which component consistently limits performance in your actual workload.
8. Why is my new PC slower than expected?
Most commonly due to misconfiguration, thermal throttling, insufficient RAM, storage limits, or unrealistic expectations for the workload.
